In week 13 2020, statistically significant excess all-cause mortality by week of death was observed overall and in the 65+ year olds in England
https://assets.publishing.service.gov.u ... report.pdf
Only England, only 65+.
Moderators: Elvis, DrVolin, Jeff
![]() by alloneword » Thu Apr 02, 2020 3:52 pm
by alloneword » Thu Apr 02, 2020 3:52 pm
In week 13 2020, statistically significant excess all-cause mortality by week of death was observed overall and in the 65+ year olds in England

![]() by alloneword » Thu Apr 02, 2020 4:06 pm
by alloneword » Thu Apr 02, 2020 4:06 pm
![]() by alloneword » Thu Apr 02, 2020 6:03 pm
by alloneword » Thu Apr 02, 2020 6:03 pm
Remember how the Coronavirus kills (in the rare cases where it does kill): by provoking an over-reaction from the host body’s immune system that attacks and destroys the host’s own cells. That is exactly what our current “immune response” of shutting down the economy will quickly achieve if we follow it very long, whether on solid grounds or in terrible error.
![]() by alloneword » Fri Apr 03, 2020 7:49 am
by alloneword » Fri Apr 03, 2020 7:49 am
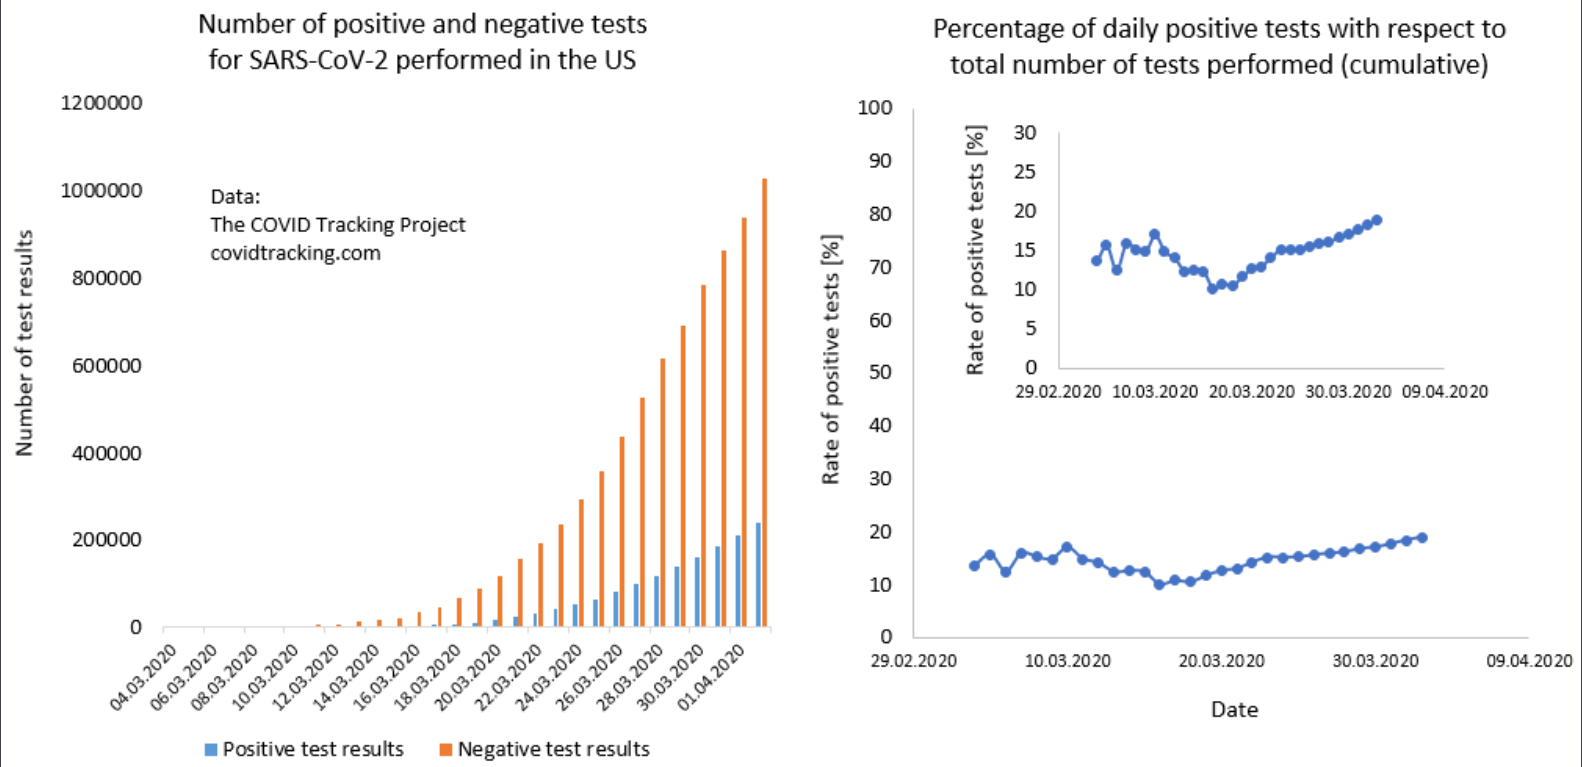
Why data on testing is needed
Without data on COVID-19 we cannot possibly understand how the pandemic is progressing.
Without data we cannot respond appropriately to the threat; neither as individuals nor as a society. Nor can we learn where countermeasures against the pandemic are working.
The number of confirmed cases is what informs us about the development of the pandemic.
But the confirmation of a case is based on a test. The World Health Organization defines a confirmed case as “a person with laboratory confirmation of COVID-19 infection”.1
Reliable data on testing is therefore necessary to assess the reliability of the data that informs us about the spread of the pandemic: the data on cases and deaths.
Some countries provide clear and helpful data on testing
Some countries present comprehensive, detailed and regularly updated data. Iceland (here) is one of these countries. Estonia (here) goes even further, showing breakdowns by age, gender and region.
For many countries however, available data on testing is either incomplete or else completely unavailable. This makes it impossible for their citizens and for researchers to assess the extent and significance of their testing efforts.
Our current knowledge of COVID-19 testing – and more importantly of the pandemic itself – would be greatly improved if all countries were able to report all the testing data available to them in the way shown by the best examples.
We need to understand what the published numbers on testing mean
Those countries that do publish testing data often do not provide the required documentation to make it clear what the provided numbers precisely mean, and this is crucial for meaningful comparisons between countries and over time.
The key questions that any data description on testing data should answer are given in the following checklist. Clear answers to these questions are what is needed to properly interpret and compare published numbers.
For citizens to trust and understand the published data and for countries to learn from each other, it is crucial that every country provides the data on testing in a clearly documented way. We hope this checklist offers helpful guidance.
Checklist of data quality questions for COVID-19 testing data
1) Is there any data?
Many countries are not yet providing official figures. Others do not do so on a regular basis. The first question to ask, then, is if there is any testing data for a given country.
Equally important is to make the available data findable. Currently, the available data is often not easy to find, because some countries are releasing figures at unpredictable intervals in ad-hoc locations (including social media or press conferences).
2) Do numbers refer to ‘performed tests’ or ‘individuals tested’?
The number of tests performed is different to the number of individuals tested. The reason for this is that it is common for COVID-19 testing that the same person is tested more than once.
Some countries report tests performed, while others report the number of individuals tested.
The source description should state clearly what is counted.
3) Are negative results included? Are pending results included?
It needs to be clear whether or not figures for the total number of tests performed, or the number of people tested, include negative test results, as well as the number of tests that are pending results.
Many sources report the number of individuals who are ‘suspected’ or have been ‘ruled out’. To be reliably included in test counts, it needs to be explicit whether such categories reflect the number of people who are awaiting test results or have tested negatively.
4) Do the figures include all tests conducted in the country, or only some?
Figures reported by countries may only be partial if not all laboratories are reporting to the central authority.
The scope of testing data should be made explicit by the source. For instance, the US CDC make it clear that their figures do not include tests conducted in private labs.
5) Are all regions and laboratories within a country submitting data on the same basis?
Answers to the questions above may vary from region to region. In order to assess the reliability of aggregate testing data, it needs to be clear if heterogenous data is being summed together.
The US COVID Tracking Project, for instance makes it clear that their US totals combine data for tests performed and individuals tested, depending on which is reported by individual states.
6) What period do the published figures refer to?
Cumulative counts of the total number of tests should make clear the date from which the count begins. The key question that needs to be answered is whether the figures published at some date (attempt to) include all tests conducted up to that date.
Because the reporting of tests can take several days, for some countries figures for the last few days may not yet be complete. It needs to be made clear by the source if this may be the case. The US CDC, for instance, makes this clear.
7) Are there any issues that affect the comparability of the data over time?
If we want to look at how testing figures are changing over time, we need to know how any of the factors discussed above may have changed too.
The Netherlands, for instance, makes it clear that not all labs were included in national estimates from the start. As new labs get included, their past cumulative total gets added to the day they begin reporting, creating spikes in the time series.
7) What are the typical testing practices in the country?
Having a sense of how often and when individuals are tested, can help the users of these statistics understand how estimates of tests performed and individuals tested might relate to each other.
For instance, how many tests does a case investigation require? What are the eligibility criteria to be tested? Are health workers, or other specific groups, being routinely retested?
8) Might any of the information above be lost in translation?
People accessing data published in a language in which they are not fluent may misinterpret the data by mistranslating the provided text, which often includes technical terms.
Many countries report testing data in multiple languages – this helps disseminate the information to a broader audience, whilst helping prevent misinterpretations.
[...]
![]() by alloneword » Fri Apr 03, 2020 8:23 am
by alloneword » Fri Apr 03, 2020 8:23 am
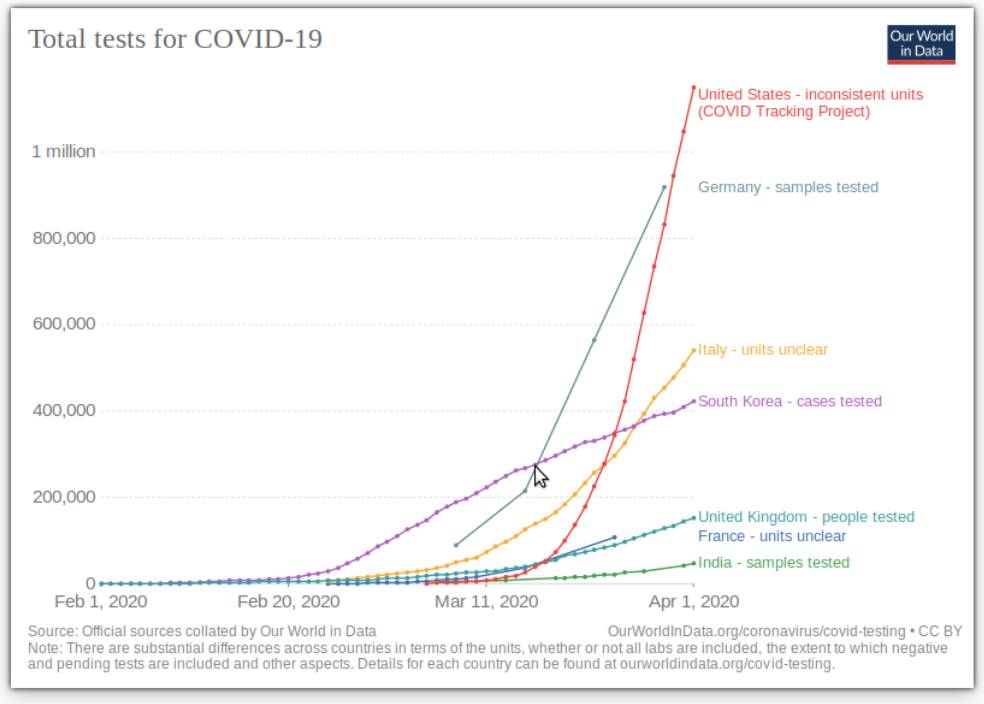
The number of tests performed or people tested so far
The chart shows the total number of tests performed, or people tested, as indicated in the legend and in the detailed notes given below for each source.
For comparisons across the series it is important to understand the definitions of the different measures. These are provided in the notes.
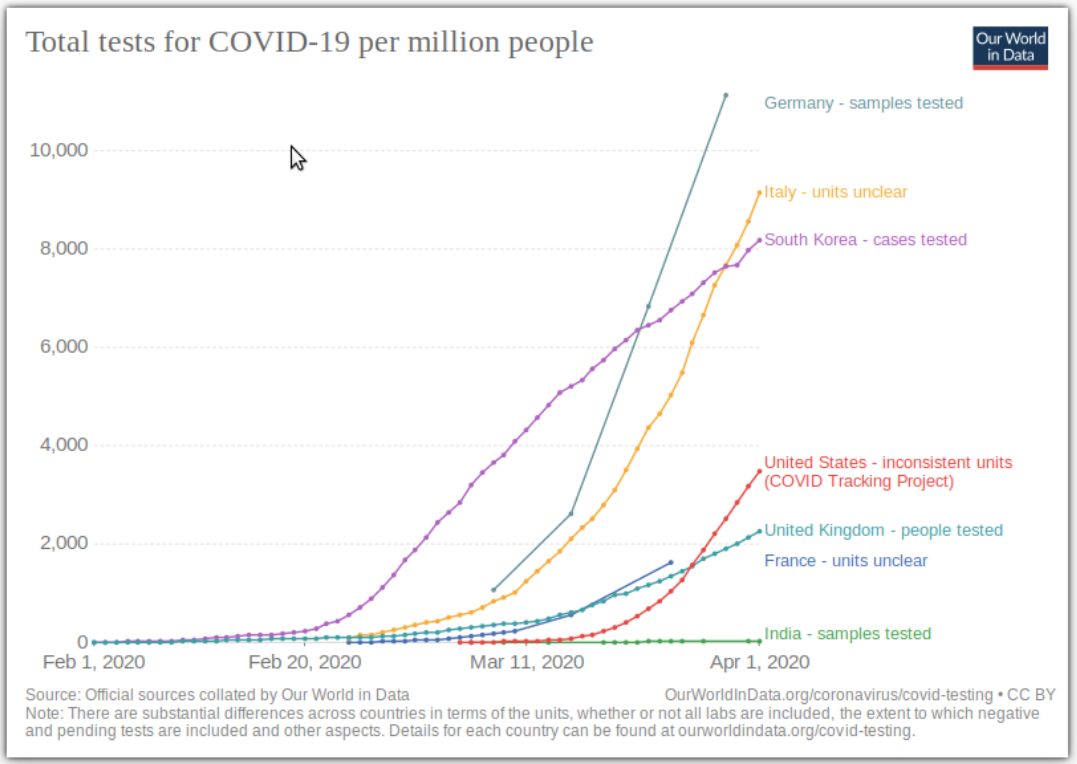
Tests per million people
The chart shows the cumulative number of tests performed, or people tested per million people, as indicated in the legend and in the detailed notes given above for each source.
For comparisons across the series it is important to understand the definitions of the different measures. These are provided in the notes.
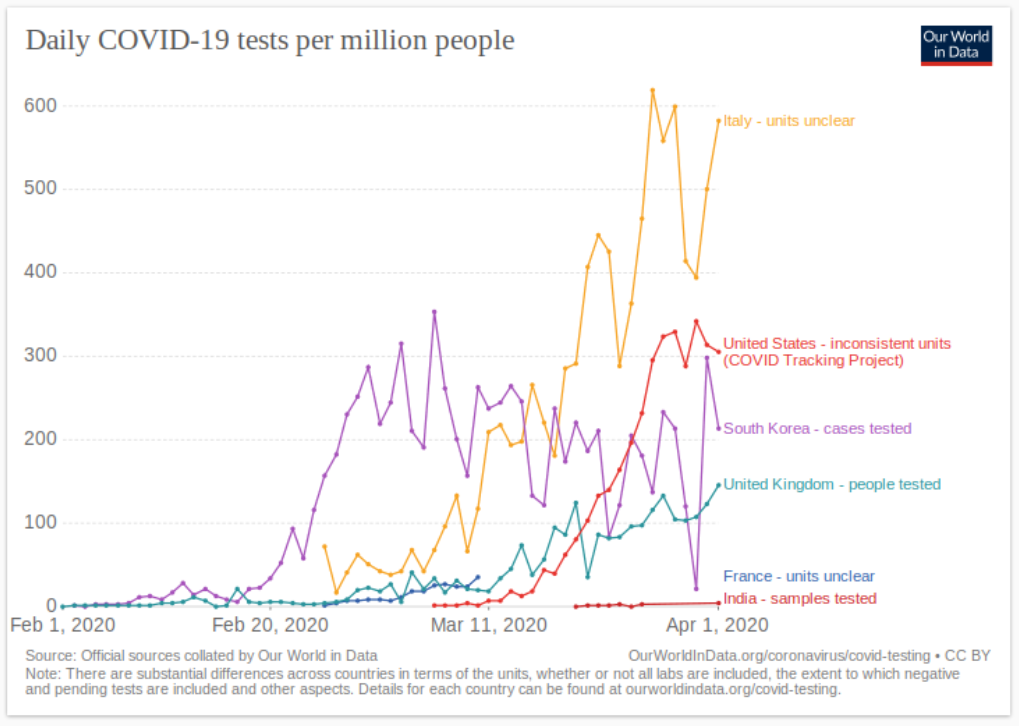
Tests per day
The two charts shown here show the daily number of tests, or people tested, in absolute terms and per million people respectively.
For comparisons across the series it is important to understand the definitions of the different measures. These are provided in the notes.

![]() by alloneword » Fri Apr 03, 2020 10:19 am
by alloneword » Fri Apr 03, 2020 10:19 am
![]() by alloneword » Fri Apr 03, 2020 10:28 am
by alloneword » Fri Apr 03, 2020 10:28 am
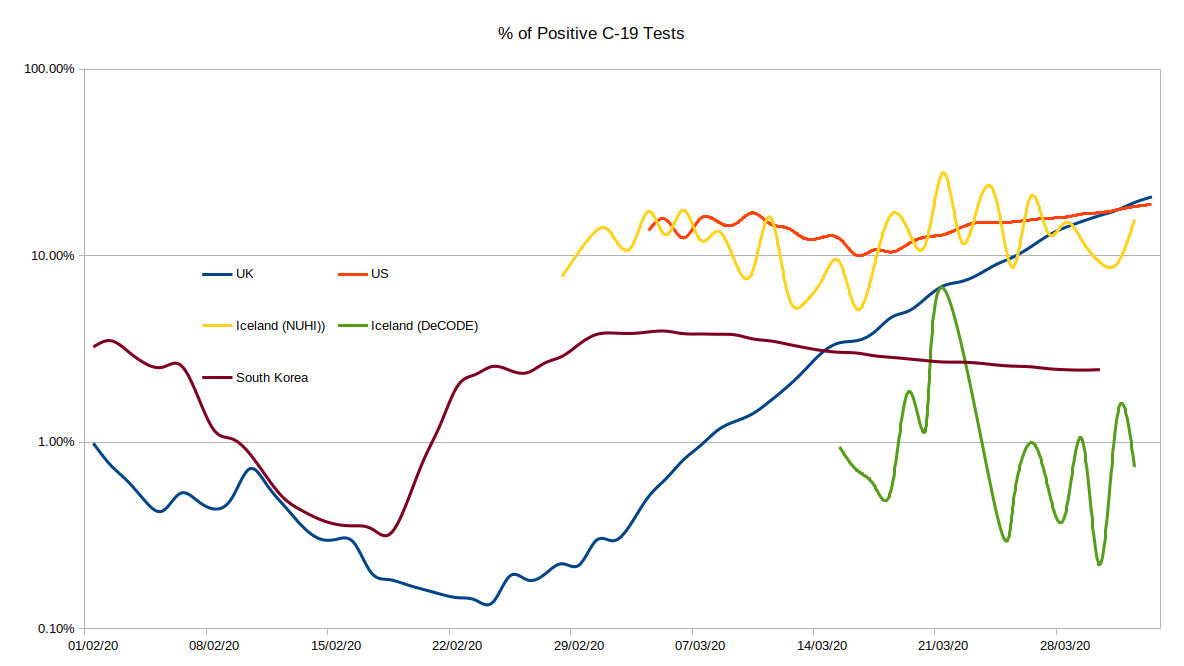
 ), US and South Korea - and Iceland. Iceland give two figures, one for the state pathology lab (who I'd assume do all the 'medical' testing, hospital admissions etc) and one for 'DeCODE', who are basically doing random elective testing of the population. The 'DeCODE' figures are likely to be more representative of the infection rate amongst the general population.
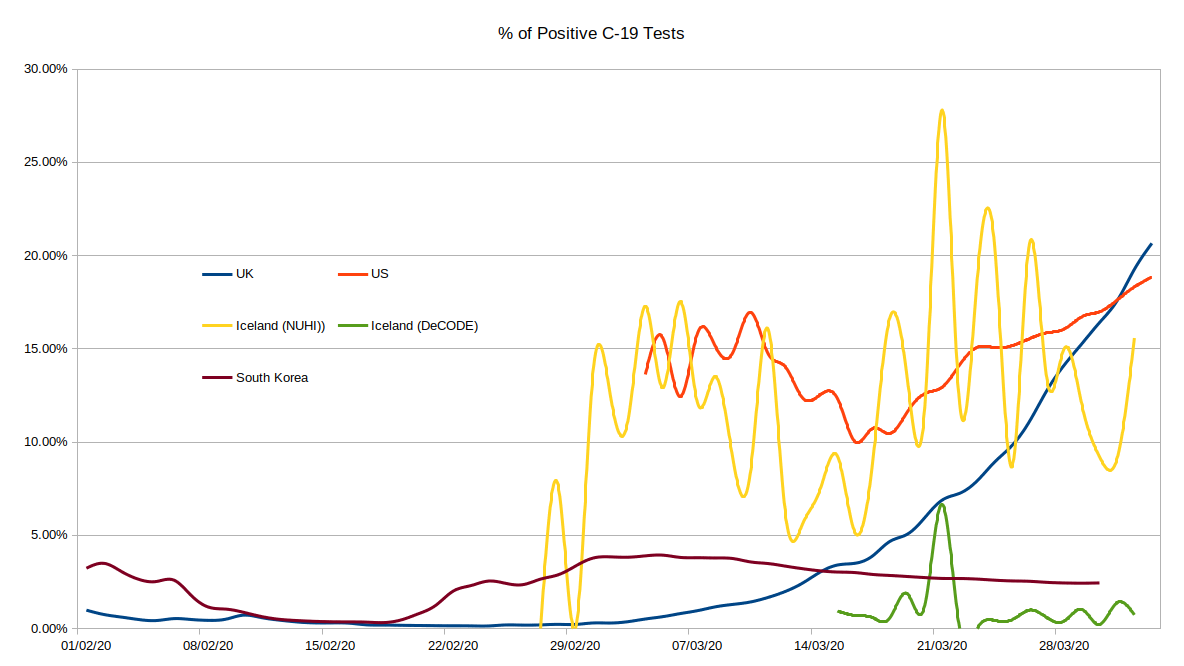
![]() by alloneword » Fri Apr 03, 2020 10:34 am
by alloneword » Fri Apr 03, 2020 10:34 am
![]() by alloneword » Fri Apr 03, 2020 1:50 pm
by alloneword » Fri Apr 03, 2020 1:50 pm
[In 2017] there were 913,646 attendances at A&E departments in England for lung illnesses
In December 2016 the BTS data shows there were 32,492 admissions resulting from A&E attendances for respiratory disease
“Nearly every winter the NHS struggles to cope with a surge of people with lung disease being admitted to hospital through A&E,” said Dr Jonathan Bennett, incoming chair of the BTS board and a lung specialist.
[In 2017] about four in 10 hospitals in England had at least one vacant respiratory consultant post, partly due to an insufficient number of lung specialists being trained at a time when demand for their services is rising.
![]() by alloneword » Fri Apr 03, 2020 2:14 pm
by alloneword » Fri Apr 03, 2020 2:14 pm
Yes, say Rudi Anschober and Bernhard Benka, member of the Corona Task Force in the Ministry of Health. "There is currently a clear rule: died with the corona virus or from the corona virus, " explains Benka. All of these cases are included in the statistics.
92,190 tests have now been carried out in Austria. In comparison with one of the "test emperors" in South Korea, we are not badly positioned. As of April 2nd, 3 p.m., we have 10,967 confirmed diseases in Austria, 1,057 in the hospital, 227 people in the intensive care unit. 1,749 are considered recovered.
And 158 people died corona-positive. You can now see the exact wording of this sentence after reading this article.
![]() by alloneword » Fri Apr 03, 2020 2:49 pm
by alloneword » Fri Apr 03, 2020 2:49 pm
In 2018 hospitals all across the United States were full to capacity with flu patients. Alabama declared a state of emergency. Elective surgeries were cancelled, patients were turned away.
California hospitals were “war zones” where people were treated in hastily erected tents.
The same year ICUs in Milan were “totally overrun” with flu cases.
In December of 2019 the NHS had to implement “emergency temporary beds” in 52% of its hospitals to account for their regular “winter crisis”. Most of those hospitals still had temporary beds operating from the previous winter.
Last November experts were publishing reports warning that the NHS was under too much pressure to deal with the seasonal flu.
The 2009 Swine Flu pandemic turned out to be no worse than a bad flu season in the end, but nevertheless had a huge impact on hospitals across the United States.
[UPDATE 3/4/18 – Our readers have done their usual stellar job and sent in some great examples.]
In Spain, flu collapses hospitals almost every year.
In 2017 the Spanish-language Huffington Post site asked “Why does the flu mean collapse in Spanish hospitals?”.
In the 2017/18 flu season, hospitals all over the country were in a state of collapse.
Last March, hospitals were atover 200% patient capacity.
In 2015 patients were sleeping in corridors.
Even in January this year, before the coronavirus had impacted Europe, nurses were complaining that the flu season was stretching healthcare to breaking point.
A paper in the JAMA (Journal of the American Medical Association) states that Lombardy’s ICUs “typically run at 85-90% capacity in the winter months”.
Going by just the last couple of years, the evidence suggests flu severely impacts health services quite frequently.
Raising the question: How does the current state of ICUs compare with these other recent crises? To which, we must remember, no one ever suggested the solution was destroying the economy and instituting a police state.
![]() by DrEvil » Fri Apr 03, 2020 4:04 pm
by DrEvil » Fri Apr 03, 2020 4:04 pm

![]() by alloneword » Fri Apr 03, 2020 6:10 pm
by alloneword » Fri Apr 03, 2020 6:10 pm
No personally identifiable information, such as an individual’s location, contacts or movement, will be made available at any point.
![]() by Elvis » Fri Apr 03, 2020 8:36 pm
by Elvis » Fri Apr 03, 2020 8:36 pm

![]() by alloneword » Sat Apr 04, 2020 3:12 pm
by alloneword » Sat Apr 04, 2020 3:12 pm
@neil_ferguson
I’m conscious that lots of people would like to see and run the pandemic simulation code we are using to model control measures against COVID-19. To explain the background - I wrote the code (thousands of lines of undocumented C) 13+ years ago to model flu pandemics...
9:13 PM · Mar 22, 2020
I am happy to say that @Microsoft and @GitHub are working with @Imperial_JIDEA and @MRC_Outbreak to document, refactor and extend the code to allow others to use without the multiple days training it would currently require (and which we don’t have time to give)...
9:13 PM · Mar 22, 2020
Return to Data & Research Compilations
Users browsing this forum: No registered users and 3 guests