Byrne wrote:US National Debt Clock:
http://www.brillig.com/debt_clock/
so each citizen's share of this debt is $34,834.15.
so do I still get my tax return?
Moderators: Elvis, DrVolin, Jeff
Byrne wrote:US National Debt Clock:
http://www.brillig.com/debt_clock/
so each citizen's share of this debt is $34,834.15.
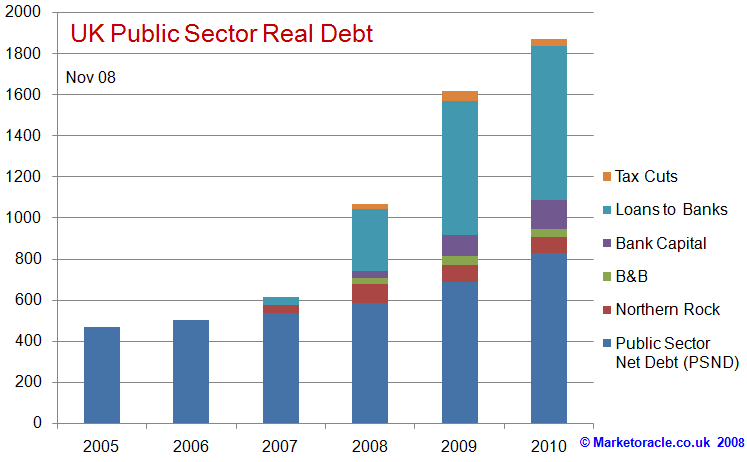
Byrne wrote:it is/was $10,639,227,038,659.27 when I wrote this
stefano wrote:Byrne wrote:it is/was $10,639,227,038,659.27 when I wrote this
And US GDP is around 15 trnUSD, no? So how do we get debt = 4x GDP?


The US government share...
would mostly be the Social Security share, as others have pointed out. The SS fund, in surplus for the entirety of its 75 year existence, has been used to finance the deficit, ostensibly on the assumption that this will be paid back into the fund.
Yes, it's ironic that the federal government approaches insolvency under the standards usually applied by the IMF, but that is never mentioned in the MSM, whereas the SS fund is considered in great danger because it will, unless demographic trends change or minor reforms are implemented, go into deficit for the first time in about 30 years.
This is the share of the debt that Bush, in possibly his most important of all statements as president, called "just a bunch of IOUs." That's in reference to US T-Bills! (He was serving notice to the world: We decide and and when and what we pay. Tough. You can't trade in all your dollars anyway.)
Thus the government is in a position to default on 35 percent of its debt without pissing off anyone who matters. (Except the entire US population: what are you gonna do about it?).


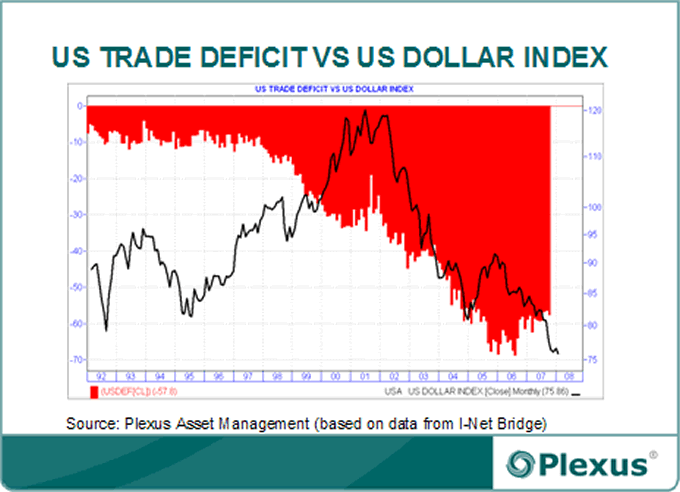
The current account deficit is now unsustainable at 6% of GDP. Since imports are bigger than exports, if they grow at a similar rate, the deficit will grow. The accumulation of debt means that we have to pay increasing interest on the debt making the balance worse. Historically, as the US GDP grows 1%, the current account deficit has grown 2%. But foreigners grow their CA by only 1% for a 1% of GDP growth. The conclusion is that the CA will get worse.
The 6 measures to identify if the CA is a problem:
Is it too big? At 6% of GDP it is bigger than the level that brought Argentina into collapse. Mexico got to 8% before its last collapse. The US absorbs 75% of the world's export surplus. A G7 country has never had such a big deficit before. The conclusion is that 6% is already too big.
.
Is it rising? Yes, suggested by the measures mentioned above.
.
What is the comparative rate of National Investment compared to the National Saving rate? If a country is making investment for future production and has a strong savings rate, it is in a stronger position. The US has the opposite with big government deficit, and little savings.
.
Does the composition of the deficit indicate weakness? If a country is running a CA deficit, by importing the means of manufacturing for example, it can be expected that investment will improve output, and thus be more sustainable than if the imports are for consumption. A measure of composition is whether the goods are traded goods, or not. The composition of the CA for the US is for consumer products, and therefore more dangerous.
.
Where are wealthy locals moving their money? The US is expanding its buying of foreign stocks. We are making foreign direct investment outside the country. The net flow out of investment adds to the view that US decision-makers do not find good value in US.
.
Is the capital flow to the US coming from private investors, who tend to be more concerned about returns than politics, or more from central banks, who may have other reasons then just profits? The US was getting about 2/3 of its investment from Central Banks, and this could be a weak position.
By all 6 measures the CA deficit is judged to be a serious risk to the US economy.
There are 3 counter arguments that the situation may not be serious:
We are the Reserve Currency. The large liquid market for US Treasuries has given us leverage and speed. It looks like local stability, but if there is a big shift, the speed could lead to explosive results. The global capital market my not give that much edge to the dollar.
.
"We will rip the foreigners off." We will depreciate the dollar enough that they will be left with less than they paid for. In fact, this has been happening. The foreign debt to GDP (nominal) ratio hasn't been expanding much. The weaker dollar means that the purchasing power of the accumulated foreign debt is not growing so rapidly. The argument has short-term merit, but the obvious flaw is that foreigners can see what is happening and may not allow it to continue. An expectation of a weaker dollar would drive the dollar down even more.
.
Bretton Woods II Co-dependency. The term refers to the regime of using the dollar, which is no longer based on gold, to manage the world economic system. The cold war term of Mutually Assured Damage can be applied to the very big holders of our debt. The foreign country that accepts US dollars in trade transactions and re-invests them in US Treasuries may not be so concerned about the dollar drifting lower, if they believe that keeping the dollar strong will benefit their own economy. We have the odd policy of asking China to raise the value of their currency, leaving them holding claims on us of decreasing value.
There will be substantial adjustments ahead:
The most similar historical time was the mid-1980s when the CA peaked at 3.5% of GDP. The fall of the dollar after 1985 caused the CA to come back in line.
.
The 1987 crash might have had some input from these unstable antecedents.
.
Japan had several parallels in its situation in the late 1980s with seemingly unending growth. China today looks like Japan of the 70s and 80s.
The trade imbalance is a substantial problem not only in the US, but globally. US purchases of world goods are necessary for other countries' economic growth. If the US fixes its CA deficit, then the rest of the world will have excess capacity. So the US fix is a problem for the world.
The relationships of the US savings rate, CA, and investment rate, leave us only limited options. The US investment (borrowing, including the government) has to be funded out of US households' savings, or from foreigners as investment of their trade-won dollars. For all these things to work, as the US cuts its CA deficit, foreign countries must stimulate their own demand to provide markets for their output. There is no simple path here. With US consumers not saving much at all, the funding of credits must come from foreigners. Asian consumers have been held back by lack of long-term mortgage lending and retail constraints. Commensurately, currency adjustment of the weaker dollar should occur against Asian currencies more than European. The economic link of the CA deficits and the budget deficit, is that a smaller fiscal deficit would help improve the CA deficit.
Summers' concluding comment was to say "I don't know the answer." His arrival at such a dire evaluation, suggests reason to be cautious about the economy and the value of the dollar for the future.
My Conclusion
I think the US trade deficit will lead to a weaker dollar. That means alternatives to US-dollar-denominated assets must be an important part of a portfolio. The US avoided a serious recession in 2001 by letting the consumer expand his spending by borrowing. We now have more debt than ever, not only internationally as described above, but also for government, and for mortgages. If foreigners were to consider other options for holding these dollars, there could be a glut of dollars in the world that would drive the exchange rate downward and prices in the US upward. If inflation rises, US interest rates could rise, and many parts of the economy could turn down, like housing, stocks and consumer spending. Because of the size of the amounts involved, and the speed of today's currency and interest rate markets, the shift could move very fast in a downward spiral.
Bud Conrad
email: budconrad@earthlink.net
Originally published on KitcoCasey on May 31, 2005.


Static vs. Flow Perspective in
Flow-of-Funds Accounts
and Financial Analysis
Written by John Atlee, November, 1959. Published as "Comment" in
The Flow-of-Funds Approach to Social Accounting --
Appraisal, Analysis, and Applications:
Studies in Income and Wealth, Volume Twenty-Six,
by the Conference on Research in Income and Wealth
(a report of the National Bureau of Economic Research, New York)
(Princeton University Press, Princeton, 1962)
Contents
The Conceptual Treatment of Money
The Concept of Credit Flows
Quantitative Estimation of Primary Credit
Preliminary adjustments
Netting out of intermediate credit
The National Credit Balance
A Flow Model for Dynamic Macroeconomic Analysis
The circuit of money flows
The money-flow equation
Analytical uses


How significant is this bear market? It all depends on how you measure. When measured in US dollars, the Dow currently trades 44% off its October 2007 record high. However, when measured with that other world currency (gold), the bear market is much more significant. To help illustrate the point, today's chart presents the Dow divided by the price of one ounce of gold. This results in what is referred to as the Dow / gold ratio or the cost of the Dow in ounces of gold. For example, it currently takes 8.4 ounces of gold to “buy the Dow.” This is considerably less that the 44.8 ounces it took back in 1999. When priced in gold, the Dow from 1999 to today is down 81%!

Users browsing this forum: No registered users and 8 guests