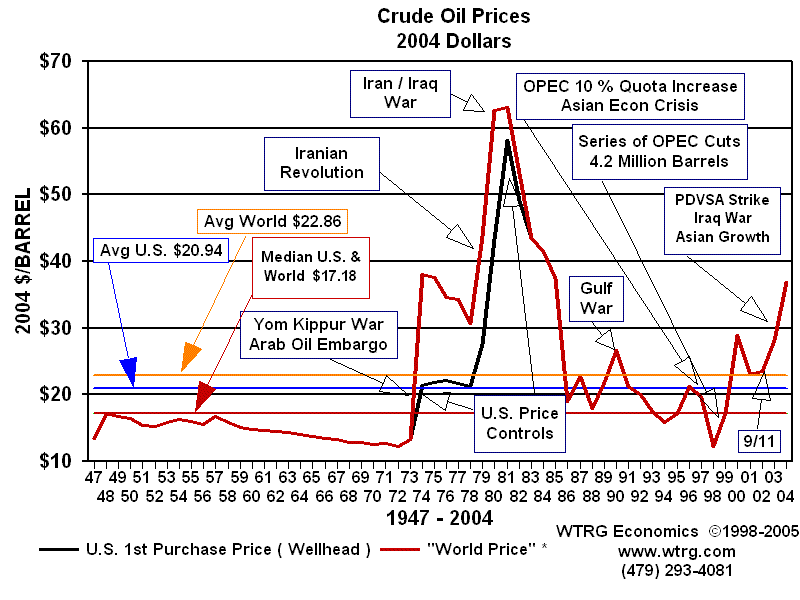
Posted:
Sat Oct 11, 2008 5:01 pmby JackRiddler
.
Note: Most recent bit not reflected. Spikes into the $140s this year and falls back to $80s today.

Posted:
Sat Oct 11, 2008 5:23 pmby rrapt
Jack, I assume these prices are inflation adjusted.
Is it possible to determine how much of the recent (1 week) fall in price is due to dollar deflation, so far unacknowledged, and how much is due to global deflation; I mean it is too soon to know what a "basket of goods" is worth these days, so we don't know the value of oil as related to that basket.
When prices fall it looks like deflation to me, but then there are those who predict hyperinflation soon. Waiting for the turnaround but not with optimism.

Posted:
Sat Oct 11, 2008 6:40 pmby JackRiddler
.
rrapt: Can't answer your questions.
From another thread, on the last few years:
.
I'm not a finance economist or a geologist, and I don't know what the "true" dollar price of oil "should" be right now, but I don't think the fluctuations in oil price are a big mystery. At least, if you take a big picture view, one that doesn't help if you're wondering how to invest money at any given moment.
First, this is a highly tradeable, indispensable commodity required by all markets everywhere. In a world where trillions in extra capital washes around every day looking for any immediate return (such as through arbitage) all fluctuations are magnified by speculative panic and euphoria. Every spike is exaggerated because volatility is what makes opportunities for the big gamblers (usually more than anything else in any given short-term period). A temporary perception of under or over supply of just one percent, for example, might translate to ten or twenty times that in percent movement of oil price. That's how the gambling natures of the traders prefer things to be.
Gas is a secondary market with fewer players, where fluctuations in movements in crude can be reflected instantly or weeks and months later, depending on where sellers see their interest because they can engage in hoarding.
The most direct cause of crude oil price fluctuation is the dollar, because oil is priced in dollars so that the long dollar fall caused oil to rise and the current dollar surge (due to a flight from the markets to T-bills and the continuing perception of the US as a haven) pushes oil prices down.
Otherwise, the driver in the speculation at any given time is the narrative that the big players most accept, which flashes around the world instantaneously as they all, so to speak, watch the same TV.
The narratives as oil went up included the dollar fall, potential instability in supply (Iraq, Nigeria, etc.), apparent alliances among key suppliers against Bush-America (Russia, Venezuela, Iran), rising demand from the new economic powers (China, India), anticipation of supply bottlenecks as capacity on currently operating fields peaks, and anticipation of peak oil historically if discoveries and energy return as well as EROEI from new field enclosures cannot keep up with consumption in the middle term.
The story drivers as oil comes down again are the rise for now in the dollar and anticipation due to the crisis of a world depression that will cut demand across the board. This should prompt the supplier nations to collaborate in reducing supply to stabilize the price, and may also act to slow down investment in new fields.
But what really comes next, and when? How the hell should I know?
.
Re: History of Crude Oil Price, 1948-2008

Posted:
Sun Jan 16, 2011 12:56 pmby JackRiddler
Annoyingly the graphic at
http://www.wtrg.com/oil_graphs/oilprice1947.gif, which would have been so enormously more popular if posted here than guns and tits that it would have eaten all of that site's bandwidth, has been protected against display.
So here's some substitutes:
History of oil prices, with graphic from OP:
http://www.wtrg.com/prices.htmOil prices 1867-present, from wikimedia, nominal and real (2008 dollars) -- follow as link because this doesn't display either:
http://upload.wikimedia.org/wikipedia/c ... 1_2007.svgTwo from
http://www.oilism.com/oil/2007/12/15/cr ... 1950-2008/

Phew.


