Mysterious and possibly nefarious trading algorithms are operating every minute of every day in the nation's stock exchanges.
What they do doesn't show up in Google Finance, let alone in the pages of the Wall Street Journal. No one really knows how they operate or why. But over the past few weeks, Nanex, a data services firm has dragged some of the odder algorithm specimens into the light.
The trading bots visualized in the stock charts in this story aren't doing anything that could be construed to help the market. Unknown entities for unknown reasons are sending thousands of orders a second through the electronic stock exchanges with no intent to actually trade. Often, the buy or sell prices that they are offering are so far from the market price that there's no way they'd ever be part of a trade. The bots sketch out odd patterns with their orders, leaving patterns in the data that are largely invisible to market participants.
In fact, it's hard to figure out exactly what they're up to or gauge their impact. Are they doing something illicit? If so, what? Or do the patterns emerge spontaneously, a kind of mechanical accident? If so, why? No matter what the answers to these questions turn out to be, we're witnessing a market phenomenon that is not easily explained. And it's really bizarre.
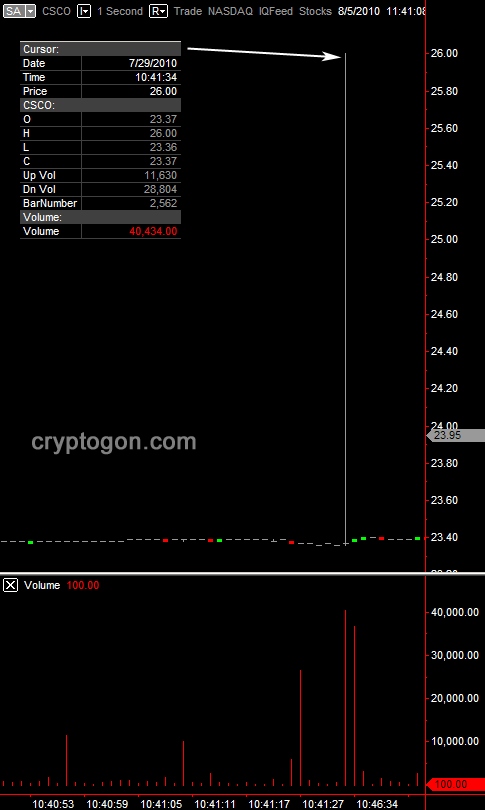
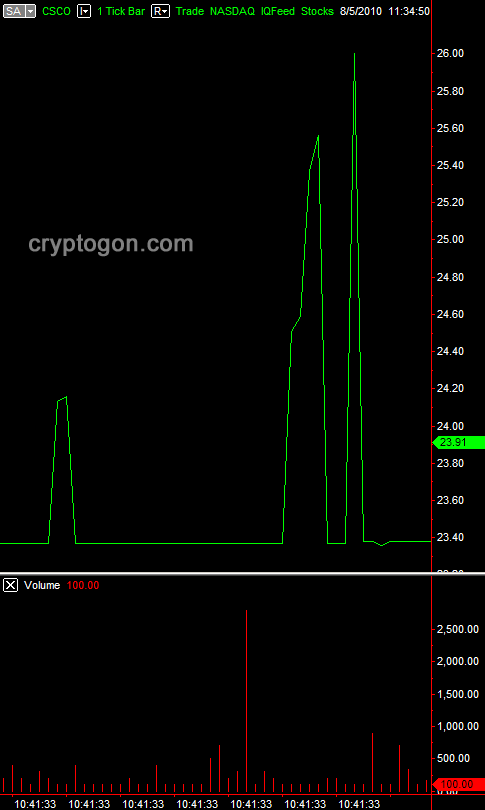
It's thanks to Nanex, the data services firm, that we know what their handiwork looks like at all. In the aftermath of the May 6 "flash crash," which saw the Dow plunge nearly 1,000 points in just a few minutes, the company spent weeks digging into their market recordings, replaying the day's trades and trying to understand what happened. Most stock charts show, at best, detail down to the one-minute scale, but Nanex's data shows much finer slices of time. The company's software engineer Jeffrey Donovan stared and stared at the data. He began to think that he could see odd patterns emerge from the numbers. He had a hunch that if he plotted the action around a stock sequentially at the millisecond range, he'd find something. When he tried it, he was blown away by the pattern. He called it "The Knife." This is what he saw:

"When I pulled up that first chart, we saw 'the knife,' we said, that's certainly algorithmic and that is weird. We continued to refine our software, honing the algorithms we use to find this stuff," Donovan told me. Now that he knows where and how to look, he could spend all day for weeks just picking out these patterns in the market data. The examples that he posts online are just the ones that look the most interesting, but at any given moment, some kind of bot is making moves like this in the stock exchange.
"We probably get 10 stocks in any 10 minutes where we see something like this," Donovan said. "It's happening all the time."
-- more at link above --
http://www.nanex.net/FlashCrash/CCircleDay.html
In our original Flash Crash Analysis report, we dedicated a section to an observed phenomena we termed "Quote Stuffing", in which bursts of quotes (at very high rates) with extremely unusual characteristics were observed.
As we continue to monitor the markets for evidence of Quote Stuffing and Strange Sequences (Crop Circles), we find that there are dozens if not hundreds of examples to choose from on any given day. As such, this page will be updated often with charts demonstrating this activity.
The common theme with the charts shown on this page is they are obviously all generated in code and are algorithmic. Some demonstrate bizarre price or size cycling, some demonstrate large burst of quotes in extremely short time frames and some will demonstrate both. In most cases these sequences are from a single exchange with no other exchange quoting in the same time frame.